The 16S-23S rRNA operon studies, which have been reported as a BioProject on NCBI, are provided via ‘PROJECT’ page. BioProjects were collected only if they were retrieved through keywords such as ‘16S-ITS-23S’, ‘16S-23S’, ‘rRNA operon’, and ‘rrn operon’. It will be updated from time to time.
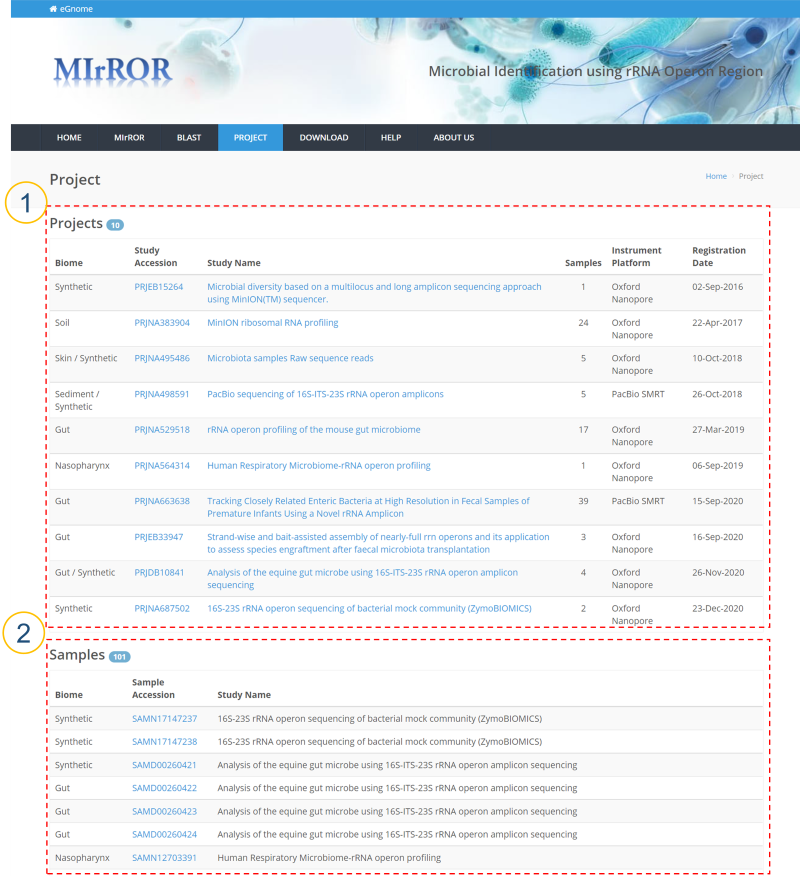
① The metagenomics study projects using 16S-23S are displayed.
-
Biome: An ecological community type. It is based on GOLD classification.
-
Study Accession: BioProject accession number.
-
Study Name: BioProject name.
-
Samples: Number of samples.
-
Instrument Platform: Sequencing platform.
-
Registration Date: Date registered by the submitter.
② BioSamples corresponding to ① are displayed.
-
Biome: An ecological community type. It is based on GOLD classification.
-
Study Accession: BioSample accession number.
-
Study Name: BioProject name to which the sample belongs.
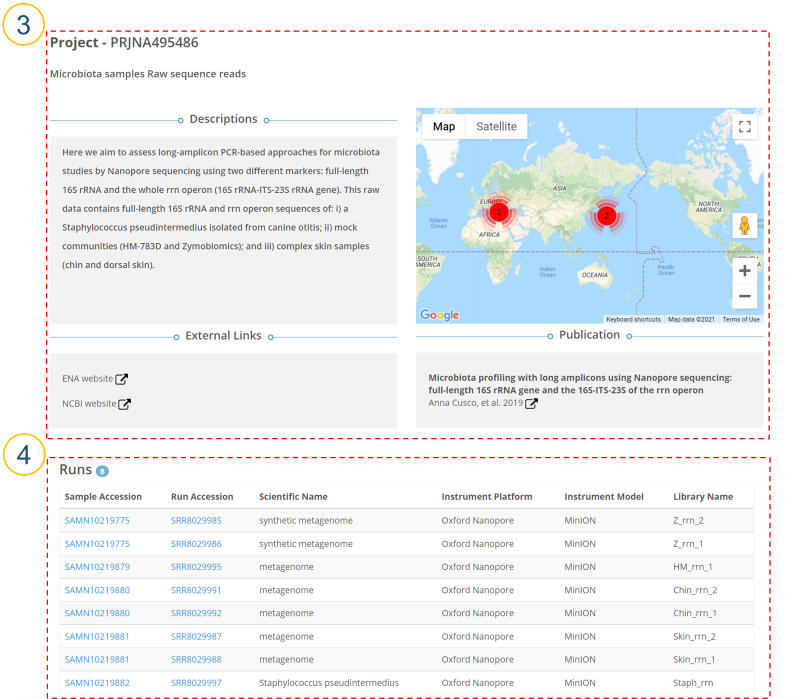
③ (①>’Study Accession’, ①>’Study Name’, ⑤>’Project’, ⑧>’Project’, ⑨>’Project’)
Users can see a detailed description of each BioProject. When sample location information is provided, it is displayed on a map. For more detailed metadata, please see ‘External Links’. Published paper related to the project is also provided.
④ Information about all runs belonging to BioProject is displayed.
-
Sample Accession: BioSample accession number.
-
Run Accession: Run accession number.
-
Scientific Name: Scientific name
- .
Instrument Name: Sequencing platform.
-
Instrument Model: Sequencing platform model.
-
Library Name: Library name.
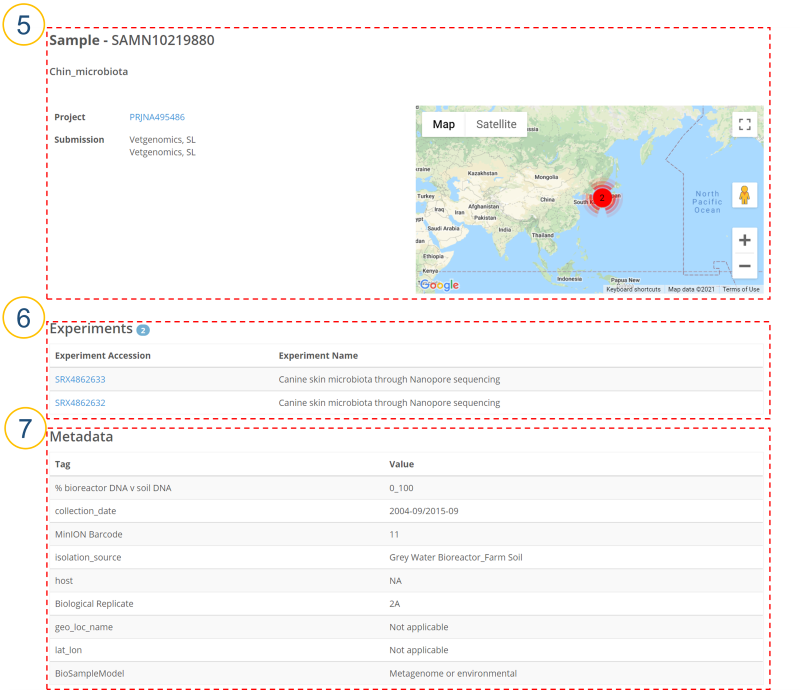
⑤ (②>’Sample Accession’, ④>’Sample Accession’, ⑧>’Sample’, ⑨>’Sample’)
Users can see a detailed description of each BioSample. When sample location information is provided, it is displayed on a map.
⑥ Information about all experiments belonging to BioSample is displayed.
-
Experiment Accession: Experiment accession number.
-
Experiment Name: Experiment name.
⑦ Metadata listed as ‘Sample attribute’ is displayed.
-
Tag: Tag of sample attribute.
-
Value: Value corresponding to the tag.
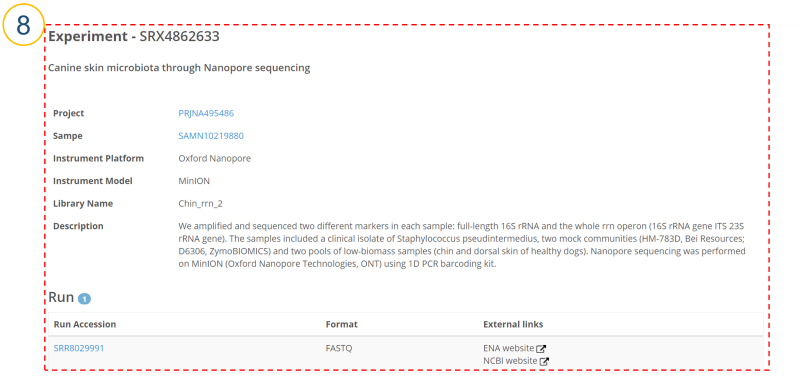
⑧ (⑥>’Experiment Accession’, ⑨>’Experiment’)
Users can see a detailed description of each Experiment.
-
Run Accession: Run accession number.
-
Format: File format.
-
External links: ENA/NCBI website for Run.
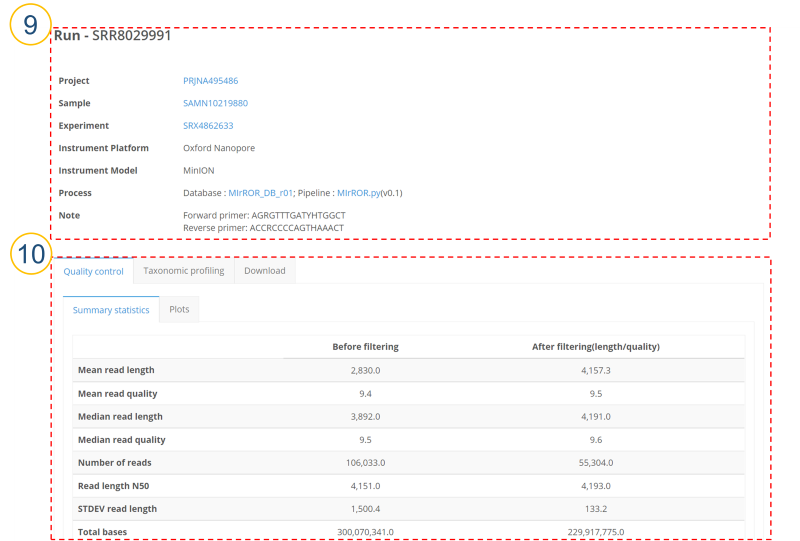
⑨ (④>’Run Accession’, ⑧>’Run Accession’)
Users can see a detailed description of each Run. If the format of Run is Fastq, the community profiling results analyzed using MIrROR database and MIrROR script are provided. Primer information used in the sample is also provided.
⑩ QC statistics for sequencing reads are provided. Filtering conditions include read size (3500q7). NanoStat was used for QC check, and NanoFilt was used for read filtering.
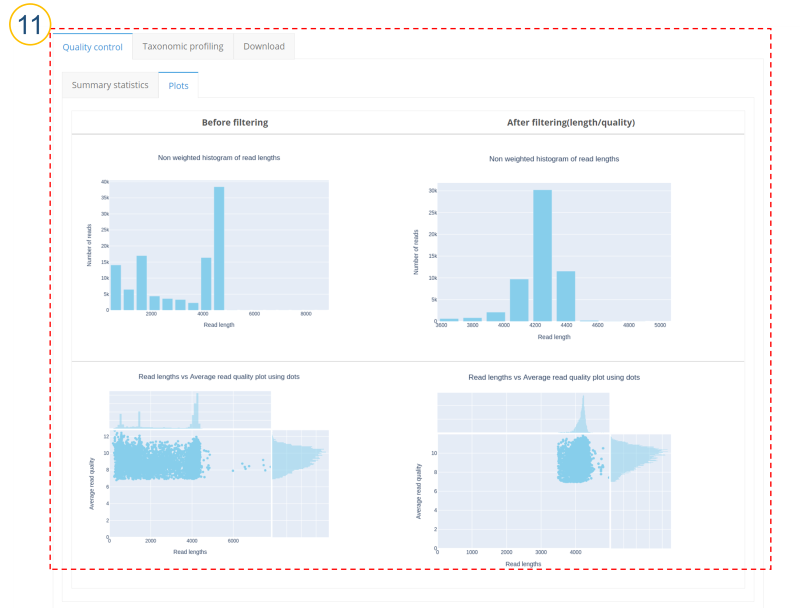
⑪ (⑩>’Quality control’>’Plots’ tab)
Plot for read length distribution and plot for read quality according to read length are displayed. NanoPlot was used for plotting.
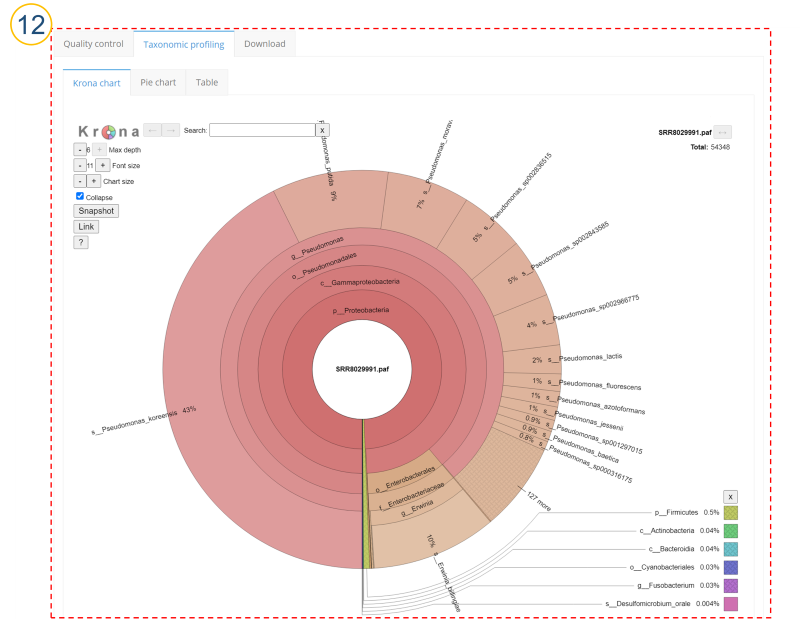
⑫ (⑩>’Taxonomic profiling’>’Krona chart’ tab)
Taxonomic profiling results are displayed as a Krona plot.
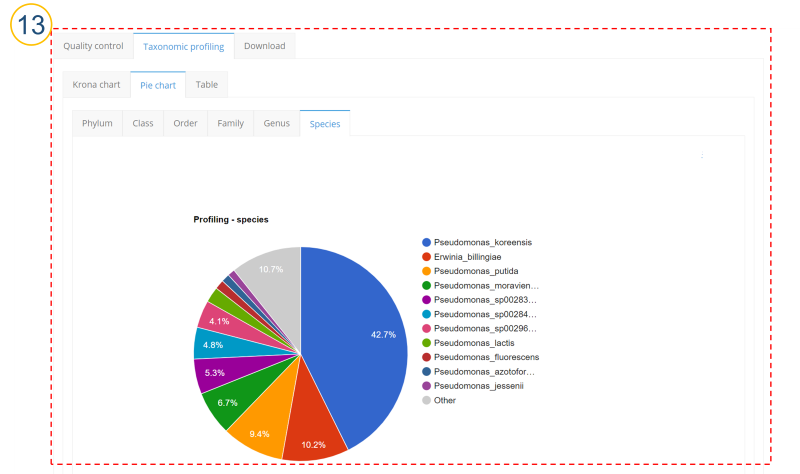
⑬ (⑩>’Taxonomic profiling’>’Pie chart’ tab)
Taxonomic profiling results are displayed as a pie plot. Users can check from the phylum level to the species level.

⑭ (⑩>’Taxonomic profiling’>’Table’ tab)
Taxonomic profiling results are displayed as MetaPhlAn style report.
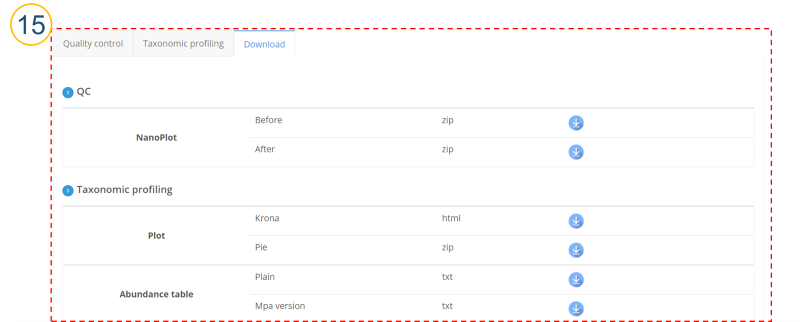
⑮ (⑩>’Download’ tab)
Users can download taxonomic profiling analysis results.


